|
I have been blessed with the joy of being able to choose many of the projects I have been involved with. My project-selection criteria hasn't always been the best. Early in my career, technology was my main motivation. In one project, I had built the best mousetrap in a world where there were very few mice to catch. Oh, so the market need is important ! Over the course of the many ups and downs in my entrepreneurial life, I was able to refine said criteria. This graph that I found floating on the Internet sea best describes it. (click to enlarge) 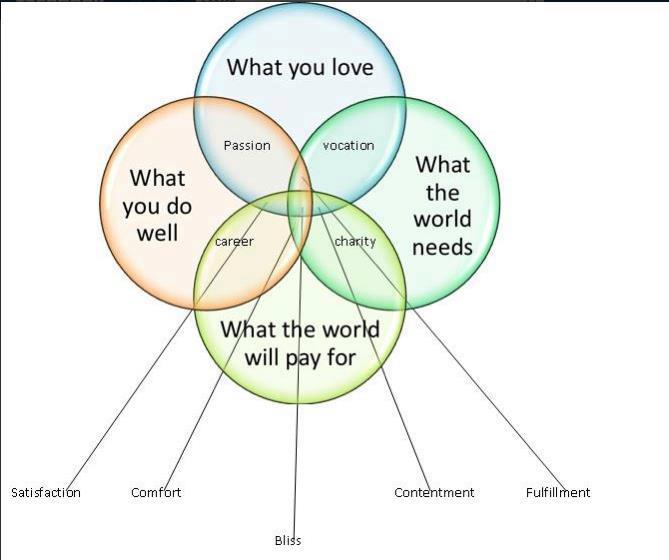 It's not always possible to find the 'Bliss' sweet spot (OK, truth be told, it's very rare), but it's something I consistently aim for. And if I can't have 'Bliss', at least I know where I am and why I am doing it.
19 Comments
In 1943, Abraham Maslow made one of the biggest contributions of the century to the study of human psychology. He created and published what is commonly known as 'The Human Hierarchy of Needs'. This post will explain the hierarchy (heavily citing Wikipedia). The next posts will apply this old-but-still-relevant pyramid to our everyday lives and, especially, to entrepreneurs seeking to develop their products. 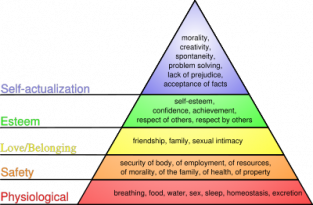 Five years ago, I attended one of my first local EO learning events in Montreal. It was a speaker who demonstrated to us the power of managing a company by simple key metrics put in a simple format. I often coach entrepreneurs when they start their businesses and, in doing so, get to the core of 'why' they want to go out on their own. I love it when dreams of boatloads of money surface. I realize that with a title like that, I need to back it up with solid facts and credible evidence. No problem. I often ask the question to my university students : "'Why do you want to be entrepreneurs, to start your business ?" |
AuthorEverything you never wanted to know about the author is on this web site : www.jeanfahmy.com Categories
All
Archives
December 2014
|
 RSS Feed